Growth Without Gridlock > Case Study - Boulder

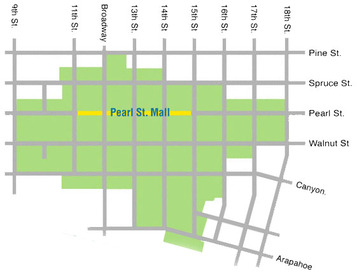
Boulder’s Transportation Demand Management measures originated in the creation of Central Area General Improvement District of 1970. The district is now a 35 block area with 160 shops and 80 restaurants and responsible for 9 off street parking facilities and 875 metered street spaces. In 1988, the Downtown Management Commission was created to oversee both the CAGID and the Pearl Street Mall area.
Meter revenue is reserved for use by CAGID and helps to fund other measures. CAGID can buy EcoPass at a discounted bulk rate to provide workers with unlimited transit use. Other perks include guaranteed ride home programs, ride-matching services and bicycle parking improvements. CAGID also has a strong incentive to create curbside metering, to the benefit of short-term retail customers.
The city has developed an EcoPass culture.
Between 1995 and 2005, the drive-alone rate by workers fell by 1/3 and the transit usage doubled to about 40%. The culture of transit is pervasive with 5 of 6 downtown workers participating in the program and half of downtown employees living within 2 blocks of a transit stop, saving an estimated 4,400 car trips into the downtown area.
In 2003, through the Transportation Master Plan update, Boulder developed a comprehensive list of potential TDM strategies for developers and businesses, as well as an evaluation matrix which lists implementer suitability, Vehicle Miles Traveled (VMT), Single Occupancy Vehicle (SOV) trips, cost implications, effectiveness measurements, political difficulty and adoption strategies
Fast Facts - Boulder
|
TDM Timeline:
1970 Central Area General Imprveoment District (CAGID) 1988 Downtown Management Commission(DMC) 2003 Transportation Master Plan (TMP) Population: 98,889 residents (2011) CAGID: 35 blocks, 160 shops, 80 restaurants, #businesses? #employees? Governance: Central Area General Improvement District (CAGID) Downtown Management Commission (DMC) Revenues - $7,283,262 (2011) Budget - $8,994,122 (2012) Trip Reduction Strategies: Metered parking at periphery of CAGID Meter Revenue funds trip reduction measures Discounted EcoPass for unlimited transit use Guaranteed ride home program Ride-matching services Bicycle parking TDM strategies & evaluation matrix Parking Costs: Parking Garage Space: $856/year Surface Parking Space: $536/year Drive Alone Mode Share: 1990 Census 61.3% 2000 Census 59.8% 2006 ACS 55.5% 2008 ACS 53.6% Other Transit Mode Shares: Transit Use 40% |

